Writing a Debugger From Scratch - DbgRs Part 5 - Breakpoints
(New to this series? Consider starting from part 1)
At the end of the last post, we started to get some interesting functionality with the ability to resolve addresses to names in a module. This was the last functionality missing before we could implement breakpoints! This part adds the ability for DbgRs to set hardware breakpoints.
The code for this post is in the part5 branch on github. You can also view the changes from part4. If you see any mistakes or ways to improve the code, feel free to create issues on the GitHub repo or submit a PR.
First, some cleanup
I’ve been trying to keep DbgRs as simple as possible, avoiding extra architectural layers to keep the concepts as clear and concise as possible, but now that it has grown a bit, we need a little bit of cleanup to keep things easy to understand. I’ll just cover these changes briefly and then we’ll get to breakpoints.
The biggest change is that I moved all of the code dealing with WaitForDebugEventEx into a new file, event.rs. A single public function allows waiting for the next debug event, and returns a new DebugEvent enum instead of the raw win32 DEBUG_EVENT type.
pub enum DebugEvent {
    Exception{first_chance: bool, exception_code: i32},
    CreateProcess{exe_name: Option<String>, exe_base: u64},
    CreateThread{thread_id: u32},
    ExitThread{thread_id: u32},
    LoadModule{module_name: Option<String>, module_base: u64},
    OutputDebugString(String),
    ExitProcess,
    Other(String)
}

pub struct EventContext {
    pub process_id: u32,
    pub thread_id: u32,
}

pub fn wait_for_next_debug_event(mem_source: &dyn MemorySource) -> (EventContext, DebugEvent) {
    //...
}
As a result, the main_debugger_loop function is a bit smaller and can focus on the core debugger loop logic.
The other change is that I’ve added a file called util.rs which has some common helpers for win32 structures, including a thin AutoClosedHandle wrapper for HANDLE and the AlignedContext struct that wraps the win32 CONTEXT. Additionally, this includes some constants that are missing from the windows-rs crate.
#[repr(align(16))]
pub struct AlignedContext {
    pub context: CONTEXT,
}

pub struct AutoClosedHandle(pub HANDLE);
Evaluating symbols
When setting a breakpoint, it’s expected that you can use the name of a function, and not just the address. So to start, we need to add the capability for resolving a name to an address. Previously, we had the resolve_address_to_name function in name_resolution.rs, so we’ll add the corresponding resolve_name_to_address function there as well.
pub fn resolve_name_to_address(sym: &str, process: &mut Process) -> Result<u64, String> {
    match sym.chars().position(|c| c == '!') {
        None => {
            // Search all modules
            Err("Not yet implemented".to_string())
        },
        Some(pos) => {
            let module_name = &sym[..pos];
            let func_name = &sym[pos + 1..];
            if let Some(module) = process.get_module_by_name_mut(module_name) {
                if let Some(addr) = resolve_function_in_module(module, func_name) {
                    Ok(addr)
                } else {
                    Err(format!("Could not find {} in module {}", func_name, module_name))
                }
            } else {
                Err(format!("Could not find module {}", module_name))
            }
        },
    }
}
For now, we’ll take only the fully qualified name in module.dll!functionName form, and allow only exact matches.
Using this function, we can add symbols to our evaluation grammar in command.rs
    #[rust_sitter::language]
    pub enum EvalExpr {
        Number(#[rust_sitter::leaf(pattern = r"(\d+|0x[0-9a-fA-F]+)", transform = parse_int)] u64),
        Symbol(#[rust_sitter::leaf(pattern = r"(([a-zA-Z0-9_@#.]+!)?[a-zA-Z0-9_@#.]+)", transform = parse_sym)] String),
In order to evaluate symbols, the evaluate_expression function now needs a context that it can use to evaluate symbols against. For this, we’ll just pass in a structure with a reference to the Process.
pub struct EvalContext<'a> {
    pub process: &'a mut Process,
}

pub fn evaluate_expression(expr: EvalExpr, context: &mut EvalContext) -> Result<u64, String> {
Note that it also returns a Result now because the name resolution can fail. Most of the function is unchanged besides passing the context through, and it now handles EvalExpr::Symbol by passing it to name_resolution::resolve_to_address.
    match expr {
        EvalExpr::Number(x) => Ok(x),
        EvalExpr::Add(x, _, y) => Ok(evaluate_expression(*x, context)? + evaluate_expression(*y, context)?),
        EvalExpr::Symbol(sym) => {
            resolve_name_to_address(&sym, context.process)
        }
    }
}
We can verify this is working by simply evaluating a symbol to an address and making sure it resolves back to the same symbol.
> ? ntdll.dll!NtMapViewOfSection+0x14
 = 0x7FFE7360F154
[11254] ntdll.dll!NtMapViewOfSection+0x14
> ln 0x7FFE7360F154
ntdll.dll!NtMapViewOfSection+0x14
[11254] ntdll.dll!NtMapViewOfSection+0x14
Success!
Keeping track of breakpoints
With the new functionality in the expression evaluator to evaluate symbols, we can add the commands for setting, clearing, and listing breakpoints. First, we add the breakpoint commands to the command grammar in command.rs
        SetBreakpoint(#[rust_sitter::leaf(text = "bp")] (), Box<EvalExpr>),
        ListBreakpoints(#[rust_sitter::leaf(text = "bl")] ()),
        ClearBreakpoint(#[rust_sitter::leaf(text = "bc")] (), Box<EvalExpr>),
The implementation of these commands need something to talk to, so we’ll create a new structure called BreakpointManager that keeps track of the breakpoints that should be set in the process, and create this at the start of the main_debugger_loop
fn main_debugger_loop(process: HANDLE) {
    let mut breakpoints = BreakpointManager::new();
We’ll get to the implementation of BreakpointManager in a minute, but first we can just see the simple implementation of bp, bl, and bc calling into the breakpoint manager.
    let cmd = command::read_command();
    //...
    match cmd {
        //...
        CommandExpr::SetBreakpoint(_, expr) => {
            if let Some(addr) = eval_expr(expr) {
                breakpoints.add_breakpoint(addr);
            }
        }
        CommandExpr::ListBreakpoints(_) => {
            breakpoints.list_breakpoints(&mut process);
        }
        CommandExpr::ClearBreakpoint(_, expr) => {
            if let Some(id) = eval_expr(expr) {
                breakpoints.clear_breakpoint(id as u32);
            }
        }
The BreakpointManager contains the list of the breakpoints that have been requested by the user. It has functions for adding a breakpoint at a specified address, removing a breakpoint given its ID, and listing the breakpoints for the user.
struct Breakpoint {
    addr: u64,
    id: u32,
}

pub struct BreakpointManager {
    breakpoints: Vec::<Breakpoint>,
}

impl BreakpointManager {

    pub fn add_breakpoint(&mut self, addr: u64) {
        self.breakpoints.push(Breakpoint{addr, id: self.get_free_id()});
        self.breakpoints.sort_by(|a, b| a.id.cmp(&b.id));
    }

    pub fn list_breakpoints(&self, process: &mut Process) {
        for bp in self.breakpoints.iter() {
            if let Some(sym) = name_resolution::resolve_address_to_name(bp.addr, process) {
                println!("{:3} {:#018x} ({})", bp.id, bp.addr, sym)
            } else {
                println!("{:3} {:#018x}", bp.id, bp.addr)
            }
        }
    }

    pub fn clear_breakpoint(&mut self, id: u32) {
        self.breakpoints.retain(|x| x.id != id)
    }
We can test these commands to make sure breakpoints are tracked correctly, although we still need to apply the breakpoints to the target process before they’ll do anything.
Command line was: '"C:\git\HelloWorld\hello.exe" '
LoadDll: 7FF7E7420000   hello.exe
[5A70] 0x00007ffdaed4aa40
> g
LoadDll: 7FFDAECF0000   ntdll.dll
[5A70] ntdll.dll!RtlUserThreadStart
> bp ntdll.dll!RtlUserThreadStart
[5A70] ntdll.dll!RtlUserThreadStart
> bl
  0 0x00007ffdaed4aa40 (ntdll.dll!RtlUserThreadStart)
[5A70] ntdll.dll!RtlUserThreadStart
> bc 0
[5A70] ntdll.dll!RtlUserThreadStart
> bl
[5A70] ntdll.dll!RtlUserThreadStart
>
Applying breakpoints
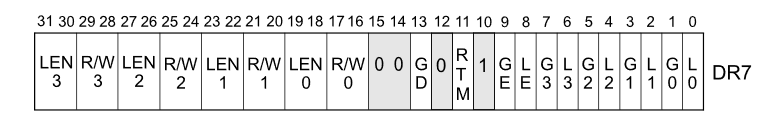
Finally, we can get to the fun part where we apply the breakpoints to a process. There are two types of breakpoints, software breakpoints and hardware breakpoints. Of the two, hardware breakpoints are less complicated, so we’ll start with those. On x86 processors the hardware breakpoints are controlled via the “Debug Registers”. There are four hardware breakpoints available on current CPUs. Debug registers DR0 through DR3 are used to specify the address of the breakpoint. Register DR6 is a status register to determine when a breakpoint is hit. And DR7 is a control register to specify the attributes of each hardware breakpoint. Note that there are a number of fields packed together in DR7, so we’ll use a little helper to set these fields.
// Helper function to set a value at a specific bit offset.
fn set_bits<T: PrimInt>(val: &mut T, set_val: T, start_bit: usize, bit_count: usize) {
    // First, mask out the relevant bits
    let max_bits = std::mem::size_of::<T>() * 8;
    let mask: T = T::max_value() << (max_bits - bit_count);
    let mask: T = mask >> (max_bits - 1 - start_bit);
    let inv_mask = !mask;

    *val = *val & inv_mask;
    *val = *val | (set_val << (start_bit + 1 - bit_count));
}
To manipulate these registers, we’ll use the GetThreadContext/SetThreadContext functions to set the registers to the state needed for the requested breakpoints. Note that the debug registers are maintained for each thread separately, so we could theoretically set different breakpoints for each thread, or filter a breakpoint to a specific thread. That functionality won’t be implemented in DbgRs for now, and we’ll just apply the same breakpoints to all threads. To start, we’ll loop over all of the threads in the process and retrieve each thread’s context:
    pub fn apply_breakpoints(&mut self, process: &mut Process, resume_thread_id: u32, _memory_source: &dyn MemorySource) {

        for thread_id in process.iterate_threads() {
            let mut ctx: AlignedContext = unsafe { std::mem::zeroed() };
            ctx.context.ContextFlags = CONTEXT_ALL;
            let thread = AutoClosedHandle(unsafe {
                OpenThread(
                    THREAD_GET_CONTEXT | THREAD_SET_CONTEXT,
                    FALSE,
                    *thread_id,
                )
            });
            let ret = unsafe { GetThreadContext(thread.handle(), &mut ctx.context) };
We’ll then loop over the requested breakpoints. We need to set four pieces of information for each one. The three fields to set are the LEN (length), RW (access type), and LE (local enable) configuration for each breakpoint. We’ll set the LEN to 0, which indicates 1 byte. We’ll set RW to 0, which means “break on instruction execution” (we would use a value of 1 indicate break on read or a value of 3 to indicate break on read or write). Finally, we’ll set the “local enable” bit to 1 indicating that the breakpoint should be enabled.
    for idx in 0..4 {
        if self.breakpoints.len() > idx {

            // The DR7_* variables are a set of constants with the correct offsets and sizes for each
            // field of DR7.
            set_bits(&mut ctx.context.Dr7, 0, DR7_LEN_BIT[idx], DR7_LEN_SIZE);
            set_bits(&mut ctx.context.Dr7, 0, DR7_RW_BIT[idx], DR7_RW_SIZE);
            set_bits(&mut ctx.context.Dr7, 1, DR7_LE_BIT[idx], 1);
The appropriate DR0-DR3 value will be set to the address of the resolved breakpoint.
            match idx {
                0 => ctx.context.Dr0 = self.breakpoints[idx].addr,
                1 => ctx.context.Dr1 = self.breakpoints[idx].addr,
                2 => ctx.context.Dr2 = self.breakpoints[idx].addr,
                3 => ctx.context.Dr3 = self.breakpoints[idx].addr,
                _ => (),
            }
Finally, we’ll make sure to disable any breakpoints that we are not using. Note that the code assumes that the debugger “owns” the debug registers and that the target process is not using them in any way. This is typically true, but there are cases where the target process will be using the debug registers for its own purpose, or are manipulated as an anti-debugging technique. To keep things simple, we won’t worry about that and just clear the local enable (LE) bit.
        } else {
            // Disable any breakpoints that we aren't using.
            set_bits(&mut ctx.context.Dr7, 0, DR7_LE_BIT[idx], 1);
            break;
        }
    }
This new function, apply_breakpoints, will be called from the main_debugger_loop right before we call ContinueDebugEvent. That will ensure that we set up all thread contexts with the correct breakpoint state. Note that because Windows sends a debug event for thread creation, we’ll have an opportunity to set the breakpoint state for all new threads that are created.
    breakpoints.apply_breakpoints(&mut process, event_context.thread_id, mem_source.as_ref());

    unsafe {
        ContinueDebugEvent(
            event_context.process_id,
            event_context.thread_id,
            continue_status,
        );
    }
Handling breakpoint exceptions
When the CPU tries to execute an instruction that is marked with a debug register, it generates a debug exception (#DB) as a fault (It’s important to note this is a fault, and not a trap. More on that later). Windows delivers this to a debugger as an exception event with exception code 0x80000004. The thread context will also have a flag set in DR6 indicating which breakpoint was hit. We’ll add some code in the exception event handler letting the breakpoint manager check if a breakpoint was hit.
        match debug_event {
            DebugEvent::Exception { first_chance, exception_code } => {
                //...
                if let Some(bp_index) = breakpoints.was_breakpoint_hit(&ctx.context) {
                    println!("Breakpoint {} hit", bp_index);
                    // It's important to use DBG_CONTINUE with ContinueDebugEvent or else the breakpoint will be treated
                    // as an exception to be handled by the target process.
                    continue_status = DBG_CONTINUE;
                }
                //...
The breakpoint manager will just check DR6 to see if any of the bits were set that correspond to a hardware breakpoint triggering.
    pub fn was_breakpoint_hit(&self, thread_context: &CONTEXT) -> Option<u32> {
        for idx in 0..self.breakpoints.len() {
            if get_bit(thread_context.Dr6, DR6_B_BIT[idx]) {
                return Some(idx as u32);
            }
        }
        None
    }
Remember how I mentioned that hardware breakpoints trigger debug exceptions as a fault? That’s important because a “fault” exception triggers before the instruction has a chance to execute. That lets us examine state before the instruction executes, which is what we want for a debugger. But since it is a fault, resuming the execution of the program just causes the program to break in again! On some architectures, this might be complicated to get past, but on x86 we simply have to set the “resume flag”, which is one of the bits in the EFlags registers that often gets overlooked. The resume flag causes the processor to ignore instruction breakpoints for a single instruction execution. It is set back to 0 right after the debug registers would have been checked, which makes it a convenient tool for resuming execution. We’ll set this flag on whatever thread caused the debugger to break in, regardless of whether the breakpoint has hit or not. (Some debuggers will only set RF when a breakpoint was hit). We’ll set the resume flag inside the apply_breakpoints function, since it’s already manipulating the register contexts of all threads.
    if *thread_id == resume_thread_id {
        set_bits(&mut ctx.context.EFlags, 1, EFLAG_RF, 1);
    }
Testing it out
Now that we can set a breakpoint, apply a breakpoint, and handle a breakpoint exception, we’re ready to test out the new breakpoint functionality. To do that, we’ll just continue execution until kernelbase is loaded, and then set a breakpoint on kernelbase!GetLastError, which is a very frequently used function that should get called almost immediately.
Command line was: '"C:\git\HelloWorld\hello.exe" '
LoadDll: 7FF7E7420000   hello.exe
[5CF8] 0x00007ffdaed4aa40
> g
LoadDll: 7FFDAECF0000   ntdll.dll
[5CF8] ntdll.dll!RtlUserThreadStart
> g
LoadDll: 7FFDAD6E0000   C:\Windows\System32\KERNEL32.DLL
[5CF8] ntdll.dll!NtMapViewOfSection+0x14
> g
LoadDll: 7FFDAC0A0000   C:\Windows\System32\KERNELBASE.dll
[5CF8] ntdll.dll!NtMapViewOfSection+0x14
> bp kernelbase.dll!GetLastError
[5CF8] ntdll.dll!NtMapViewOfSection+0x14
> g
Breakpoint 0 hit
[5CF8] C:\Windows\System32\KERNELBASE.dll!GetLastError
>
It works! It’s almost starting to feel like a real debugger. A few very important things are left though. To start with, we can’t see the functions that are on the call stack. Viewing the stack is probably the single most important analysis feature of a debugger. So that’s likely where we’re going next.
I hope you found this post interesting and informative! Have a question or suggestion? Let me know! You can find me on Twitter, Mastodon, and Bluesky.