Writing a Debugger From Scratch - DbgRs Part 6 - Stacks
(New to this series? Consider starting from part 1)
At the end of the last post, DbgRs could finally set breakpoints. That was the last really critical feature needed for controlling execution of a program. Now that it can stop on an arbitrary function or code location, the next step is to find more information about the state of the program. In my opinion, the single most useful piece of information is the call stack, so that’s what this post will be about. Walking call stacks is the most complicated piece of DbgRs so far, and as such this post is somewhat longer than the others. Stick through to the end, though, it’s worth the payoff! To keep this post as readable as I can, I’ve used footnotes for anything that isn’t strictly needed to understand how the stack walking works.
The code for this post is in the part6 branch on github. You can also view the changes from part5. If you see any mistakes or ways to improve the code, feel free to create issues on the GitHub repo or submit a PR. I’ve had a few folks contribute changes and I really appreciate it!
Disclaimer: Everything in this post is very specific to x64 Windows code. Stack walking is very different from architecture to architecture and OS to OS. On many platforms, stack walking is significantly simpler. But since DbgRs is specifically an x64 Windows debugger, that’s what this post is going to talk about.
What IS a stack frame?
When we talk about a call stack (sometimes called backtrace), what we’re actually talking about are a stack of frames for a thread. You can think of a frame as the state of a function as it is executing. If function A calls function B, then function A needs to save its state (like local variables) somewhere so that when function B returns, function A can continue executing where it left off. In most cases, this state is saved on a stack. While each frame contains local variables, they also contain the return address, which is the next instruction to be executed when a function returns from a call. When a debugger displays a stack trace, it is enumerating the frames to find the list of return addresses and local variables from each frame. And in reality, both the instruction pointer and local variables are determined from a register context, so we can think of the stack walk as starting with the register context for a thread as the “top” of the stack, and repeatedly “unwinding” that register context to get the register context of the calling function.
So the fundamental operation we need to implement is to take a register context and the memory of a process and transform that into the register context of the calling function. Start with the “top” of the stack, which is just the current context of a thread, and apply this “stack walk” operation repeatedly (printing the names of each function we find at RIP), and we have our basic stack walk!
Frame pointers
So how do we walk from one frame to the next? For those of you that have taken an operating systems class, you might be thinking “use frame pointers!”. So then, what is a frame pointer? While the stack pointer (RSP) points to the “top” of the stack, the frame pointer (RBP) points to the start of the current function’s frame. Using a frame pointer means we can find all of the local variables and other saved state for a function call as constant offsets from RBP.
A stack pointer is used for tracking the location of the last data that was “pushed” on the stack, and a frame pointer tracks the start of the stack for a function call, also know as the function’s “frame”. A frame contains all of the data for the invocation of a function, potentially including locals, arguments, and saved copies of nonvolatile registers. Local variables are referenced as constant offsets to the frame pointer.
When a function uses frame pointers, the first few instructions will push the frame pointer onto the stack, and then set up the new frame pointer with the current stack pointer with some code that might look something like this.
00007ffa`7144b824 55              push    rbp
00007ffa`7144b825 488bec          mov     rbp,rsp
When returning from the function, the caller’s base pointer is popped off the stack, and then execution is returned with a ‘ret’.
00007ffa`7144b824 5d              pop     rbp
00007ffa`7144b825 c3              ret
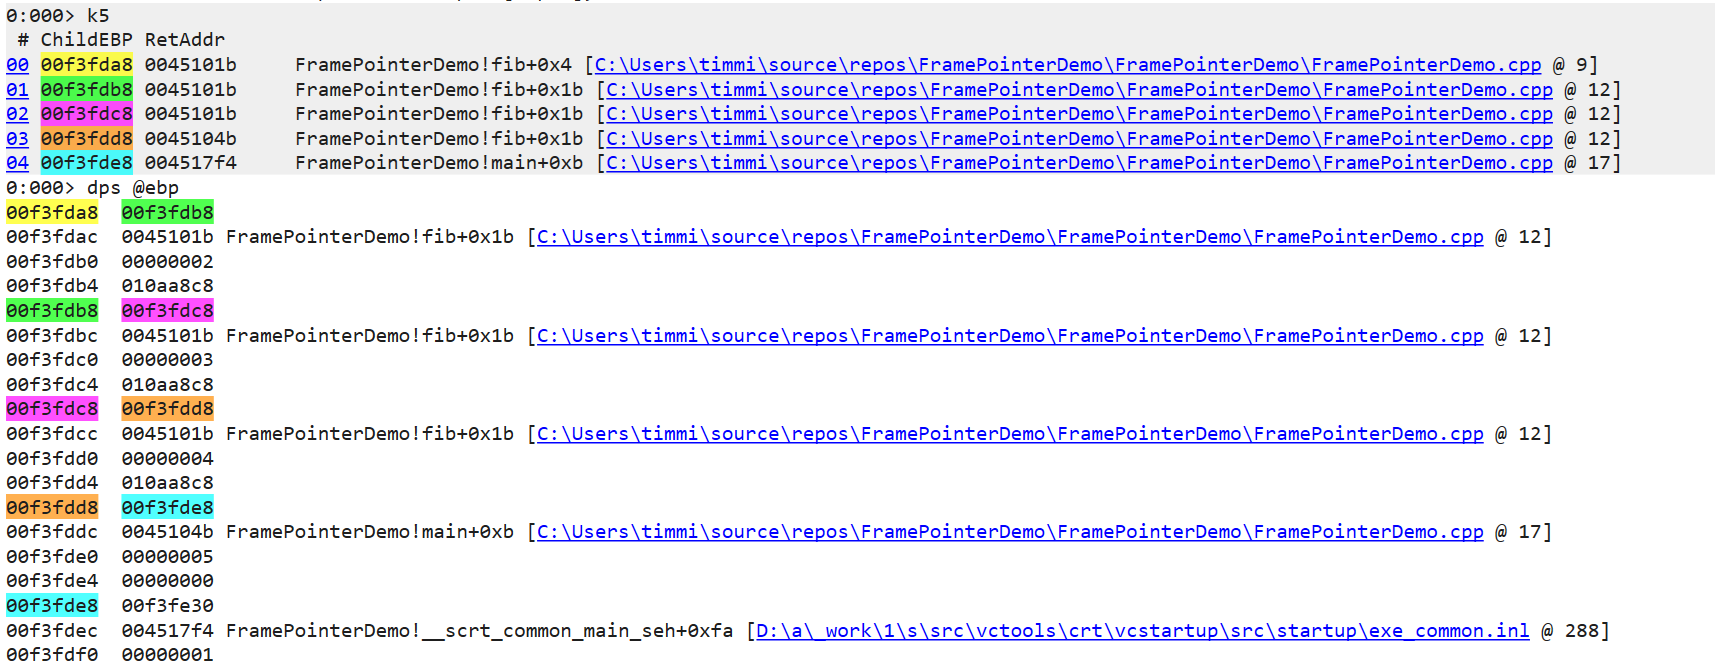
When every function does this, the frame pointers form a linked list, with the return address immediately preceding the frame pointer on the stack. This makes it very easy to walk the list on the stack, using the current frame pointer (EBP on x86) as the head pointer of the list.
If everyone used frame pointers, this blog post would be extremely short. But if you’ve glanced at your scroll bar, you’ve figured out that frame pointers aren’t the end of the story. And that’s because of a little thing called “Frame Pointer Omission” (FPO).
In a typical function that allocates a static amount of memory on the stack, the frame pointer is redundant. The compiler knows that a function consumes N bytes of stack, so it adds N to the stack pointer when returning, and all locals can be referenced relative to the stack pointer instead of a frame pointer. And if some part of a function uses some additional stack, such as pushing parameters onto the stack for another function, the compiler can still determine at compile time how the offsets of these local variables shift at each instruction of the function. By referencing locals off the stack pointer instead of a frame pointer, it means that an entire register is freed up to be used for other purposes. On Windows, nearly all 64-bit x64 code is compiled with FPO enabled. (CORRECTION: As Aaron Giles points out, FPO is off by default on ARM64, so this is specific to x64, not all 64-bit Windows code)
That’s a problem for diagnostic tools that want to do stack walks, because they can no longer determine the location of the return address or calling function’s frame address from a frame pointer. Luckily, there’s a solution.
The “.pdata” section
What makes FPO possible is that compilers always know the size of a frame at a given instruction. It lets the compiler generate offsets to local variables correctly, and it also lets the compiler generate a correct epilog for a function to correctly return to the caller. So to enable diagnostic tools (and exception handling) to do the same thing, this information is stored with an executable file. On Windows, this data is stored in a section called “.pdata”. Since the OS uses this information for exception handling, much of the documentation can be found in the MSDN docs for exception handling. The “.pdata” section does not exist for 32-bit x86 executables, and I won’t be discussing here how stack walking works for 32-bit x86 code (short version: it’s messy).
So let’s take a short tour of what pdata looks like using WinDbg to examine the data. We’ll start a debugging session of an x64 process and take a look at the pdata for kernel32. I’m using cmd.exe here, but any x64 process should work. We can use the “!dh” extension command (Dump Header) as our starting point.
0:000> !dh kernel32

File Type: DLL
FILE HEADER VALUES
    8664 machine (X64)
       7 number of sections
D05C34F8 time date stamp Wed Oct  9 05:50:00 2080

...

   C2000 [     520] address [size] of Resource Directory
   BB000 [    5508] address [size] of Exception Directory
   C3000 [    4160] address [size] of Security Directory

...

SECTION HEADER #4
  .pdata name
    5508 virtual size
   BB000 virtual address
    6000 size of raw data
   BA000 file pointer to raw data
       0 file pointer to relocation table
       0 file pointer to line numbers
       0 number of relocations
       0 number of line numbers
40000040 flags
         Initialized Data
         (no align specified)
         Read Only
Note the address of the “Exception Directory” and the address of the “.pdata” section are both 0xBB000. These are both names for the same data, although the Exception Directory is the authorative source here. If we dump data at that address, we see a collection of RUNTIME_FUNCTION structures.
typedef struct _IMAGE_RUNTIME_FUNCTION_ENTRY {
  DWORD BeginAddress;
  DWORD EndAddress;
  union {
    DWORD UnwindInfoAddress;
    DWORD UnwindData;
  } DUMMYUNIONNAME;
} RUNTIME_FUNCTION, *PRUNTIME_FUNCTION, _IMAGE_RUNTIME_FUNCTION_ENTRY, *_PIMAGE_RUNTIME_FUNCTION_ENTRY;
0:000> dd kernel32+BB000
00007ffa`2bf9b000  00001010 0000115a 00098428 00001160
00007ffa`2bf9b010  0000119f 00098444 00001210 00001406
00007ffa`2bf9b020  0009844c 00001440 00001613 00098470
Each structure is a 32-bit offset to the start of a function (relative to the base address), followed by a 32-bit offset to the end of the function (one byte past the end actually), and finally a 32-bit offset to the unwind data itself. The structures are packed together, so you can see a pattern repeated every three dwords. If you look closely, you’ll also see that the “BeginAddress” field is increasing for each entry, meaning that this table is sorted. We’ll focus on the first entry in this table, which is the first three dwords.
0:000> dd kernel32+BB000 L3
00007ffa`2bf9b000  00001010 0000115a 00098428
That gives us a BeginAddress of 0x1010, an EndAddress of 0x115a, and an UnwindInfoAddress of 0x98428. Adding the module base address to the BeginAddress gives us the address of the function this entry is annotating, which happens to be kernel32!Module32NextW.
0:000> u kernel32+00001010
KERNEL32!Module32NextW:
00007ffa`2bee1010 4c8bdc          mov     r11,rsp
00007ffa`2bee1013 49895b08        mov     qword ptr [r11+8],rbx
00007ffa`2bee1017 57              push    rdi
00007ffa`2bee1018 4883ec50        sub     rsp,50h
00007ffa`2bee101c 33ff            xor     edi,edi
Using the UnwindInfoAddress of 0x98428, we can find the unwind data which contains the information we need to unwind this function. The data stored here is described by the UNWIND_INFO structure.
typedef struct _UNWIND_INFO {
    UBYTE Version       : 3;
    UBYTE Flags         : 5;
    UBYTE SizeOfProlog;
    UBYTE CountOfCodes;
    UBYTE FrameRegister : 4;
    UBYTE FrameOffset   : 4;
    UNWIND_CODE UnwindCode[1];
/*  UNWIND_CODE MoreUnwindCode[((CountOfCodes + 1) & ~1) - 1];
*   union {
*       OPTIONAL ULONG ExceptionHandler;
*       OPTIONAL ULONG FunctionEntry;
*   };
*   OPTIONAL ULONG ExceptionData[]; */
} UNWIND_INFO, *PUNWIND_INFO;
We can dump the memory for this structure using db
0:000> db kernel32+98428
00007ffa`2bf78428  01 0c 04 00 0c 34 0c 00-0c 92 08 70 21 00 00 00  .....4.....p!...
This data is a bit harder to decode by hand, but I’ll point out the interesting values here. The first byte is a combination of version and flags. Version is always 1, according to the docs, but the flags can have the following values:
| Name | Value | Meaning |
|---|---|---|
UNW_FLAG_NHANDLER | 0x0 | The function has no handler. |
UNW_FLAG_EHANDLER | 0x1 | The function has an exception handler that should be called. |
UNW_FLAG_UHANDLER | 0x2 | The function has a termination handler that should be called when unwinding an exception. |
UNW_FLAG_CHAININFO | 0x4 | The FunctionEntry member is the contents of a previous function table entry. |
For this entry, there are no flags set. For the purposes of walking the call stack, we can ignore exception handlers, although eventually we will need to handle. The next value is SizeOfProlog, which is 0xC. Looking at the disassembly again, and we can see this corresponds to the address of the first instruction after the “sub rsp, 50h” instruction:
0:000> u kernel32+00001010
KERNEL32!Module32NextW:
00007ffa`2bee1010 4c8bdc          mov     r11,rsp
00007ffa`2bee1013 49895b08        mov     qword ptr [r11+8],rbx
00007ffa`2bee1017 57              push    rdi
00007ffa`2bee1018 4883ec50        sub     rsp,50h
00007ffa`2bee101c 33ff            xor     edi,edi
The third byte is CountOfCodes, which is 0x4 here. We’ll look at that more in a moment. Finally, the fourth byte indicates which frame register is used (if any) and what offset to apply (if any). Here, the value is zero, which means that no frame register is used.
Unwind codes
Immediately following the UNWIND_INFO structure are the “unwind codes”. These describe the operations in the prolog, and can be used to “undo” the state of the prolog, getting the state of a stack and context back to the initial state when the function was called, making it possible to find the return address and register state for the caller. While the UNWIND_CODE structure is 16 bits, some operations consume multiple “slots”. The “count of codes” field from UNWIND_INFO actually describes the number of slots consumed, rather than the number of operations. Here’s the C description of the codes, taken from the documentation page:
typedef enum _UNWIND_OP_CODES {
    UWOP_PUSH_NONVOL = 0, /* info == register number */
    UWOP_ALLOC_LARGE,     /* no info, alloc size in next 2 slots */
    UWOP_ALLOC_SMALL,     /* info == size of allocation / 8 - 1 */
    UWOP_SET_FPREG,       /* no info, FP = RSP + UNWIND_INFO.FPRegOffset*16 */
    UWOP_SAVE_NONVOL,     /* info == register number, offset in next slot */
    UWOP_SAVE_NONVOL_FAR, /* info == register number, offset in next 2 slots */
    UWOP_SAVE_XMM128 = 8, /* info == XMM reg number, offset in next slot */
    UWOP_SAVE_XMM128_FAR, /* info == XMM reg number, offset in next 2 slots */
    UWOP_PUSH_MACHFRAME   /* info == 0: no error-code, 1: error-code */
} UNWIND_CODE_OPS;

typedef unsigned char UBYTE;

typedef union _UNWIND_CODE {
    struct {
        UBYTE CodeOffset;
        UBYTE UnwindOp : 4;
        UBYTE OpInfo   : 4;
    };
    USHORT FrameOffset;
} UNWIND_CODE, *PUNWIND_CODE;
The UNWIND_INFO structure is 4 bytes, so we can add 4 to the UnwindInfoAddress to get the array of unwind codes. As we determined from the CountOfCodes field, there are 4 slots. Each slot is 16 bits, so we’ll dump the next 8 bytes.
0:000> db kernel32+98428+4 L8
00007ffa`2bf7842c  0c 34 0c 00 0c 92 08 70                          .4.....p
The first code here “0C 34” has an offset of 0xC, an unwind operation of 0x4, and an “OpInfo” field of 0x3. Operation 4 is UWOP_SAVE_NONVOL, so the OpInfo field corresponds to the register being saved, which for 0x3 corresponds to RBX. For UWOP_SAVE_NONVOL, the subsequent slot is used as the offset from the stack pointer (scaled by 8, since all access is 64-bit aligned). The 16-bit value following the first slot is 0xC (remember, this is little endian so 0C 00 bytes become 0x000C as a 16-bit value). Scaling by 8, we get 0xC * 8 == 0x60. Looking at the prolog again you can see RBX is saved to the stack as the second instruction in the prolog at offset RSP+8. With the other operations of the prolog updating RSP, the address of this location ends up being RSP+0x60. See the annotated assembly below to see how this happens.
0:000> u kernel32+00001010 L6
KERNEL32!Module32NextW:
00007ffa`2bee1010 4c8bdc          mov     r11,rsp                # Copies RSP into R11
00007ffa`2bee1013 49895b08        mov     qword ptr [r11+8],rbx  # Writes RBX to the stack at [RSP+8]
00007ffa`2bee1017 57              push    rdi                    # Decrements RSP by 8, so RBX is now at [RSP+0x10]
00007ffa`2bee1018 4883ec50        sub     rsp,50h                # Decrements RSP by 0x50, so RBX is now at [RSP+0x60]
00007ffa`2bee101c 33ff            xor     edi,edi                # This is offset 0xC into the function
00007ffa`2bee101e 488bda          mov     rbx,rdx                # This is where the original RBX is overwritten
Decoding these by hand is exhausting, but luckily there’s an easy shortcut when using WinDbg. The .fnent command will decode all of the unwind operations in an easy to read format!
0:000> .fnent kernel32!Module32NextW
Debugger function entry 000001cb`f8df4aa0 for:
(00007ffa`2bee1010)   KERNEL32!Module32NextW   |  (00007ffa`2bee1160)   KERNEL32!ThpCopyAnsiToUnicode
Exact matches:
    KERNEL32!Module32NextW (void)

BeginAddress      = 00000000`00001010
EndAddress        = 00000000`0000115a
UnwindInfoAddress = 00000000`00098428

Unwind info at 00007ffa`2bf78428, c bytes
  version 1, flags 0, prolog c, codes 4
  00: offs c, unwind op 4, op info 3	UWOP_SAVE_NONVOL FrameOffset: 60 reg: rbx.
  02: offs c, unwind op 2, op info 9	UWOP_ALLOC_SMALL.
  03: offs 8, unwind op 0, op info 7	UWOP_PUSH_NONVOL reg: rdi.
The operations are listed in reverse order, which is very convenient when unwinding the stack, since the operations need to be applied in reverse order to reverse the operations of the prolog. Unwinding the stack while in the middle of a prolog is also possible. We just need to skip any of the unwind operations that occur after the current instruction.
What about the epilog???
It might seem strange to you that we have so much metadata about the prolog, but nothing about the epilog! If code is currently executing in the middle of an epilog, we don’t know which prolog operations have already been reversed, so attempting to follow the unwind operations could get us into a completely bogus state. And the answer might be a little surprising. To unwind the stack while in an epilog, we need to read the code stream to determine if we are in an epilog, and if so, we simply emulate the remaining portion of the epilog. This is feasible only because epilogs have very strict rules that make it easy to detect and simulate epilogs. The epilog must always:
- Deallocate the “fixed part” of the stack
- Pop all nonvolatile registers
- Return control to the caller (via “ret”)
The deallocation of the fixed part of the stack must only use an ADD or LEA instruction, and the nonvolatile pops must use the POP <reg> instructions. To detect an epilog, we start reading code bytes and stop if we ever hit an instruction that is not legal inside an epilog or if we hit a ret instruction. Hitting a ret before any instructions invalid for an epilog means the current instruction is in a valid epilog.
Unwinding the context in DbgRs
All of this is enough information for us to unwind a register context. Our main function will simply be called “unwind_context” and will take a context and optionally return a new context if a calling frame is found. We need to include memory (for reading the stack) and the process information where we keep track of modules.
pub fn unwind_context(process: &mut Process, context: CONTEXT, memory_source: &dyn MemorySource) -> Result<Option<CONTEXT>, &'static str> {
If we find a module for the instruction pointer, we’ll use that to find the “exception” directory where the function table lives.
    let module = process.get_containing_module_mut(context.Rip);
    if let Some(module) = module {
        let data_directory = module.get_data_directory(IMAGE_DIRECTORY_ENTRY_EXCEPTION);
        if data_directory.VirtualAddress != 0 && data_directory.Size != 0 {
            let count = data_directory.Size as usize / std::mem::size_of::<RUNTIME_FUNCTION>();
            let table_address = module.address + data_directory.VirtualAddress as u64;
            // Note: In a real debugger you might want to cache these.
            let functions: Vec<RUNTIME_FUNCTION> = read_memory_full_array(memory_source, table_address, count)?;
All of the RUNTIME_FUNCTION entries describe functions as relative virtual address, which are relative to the module base. So we’ll subtract the module base to get the rva of our instruction pointer. From there, we can do a search of the table, which can be done using a binary search bcause the functions entries are always in order. (The implementation of find_runtime_function is here)
            let rva = context.Rip - module.address;
            let func = find_runtime_function(rva as u32, &functions);
If we find a match, we’ll read the unwind info and operations so we can apply them to the context. Once we’ve parsed out the information from the main UNWIND_INFO structure, we can use the UNWIND_INFO::count_of_codes field to determine how many 16-bit codes should be read. Remember that this isn’t the number of operations, as many operations take multiple “code slots”. Once we have the Vec of u16 codes, we’ll pass it to get_unwind_ops which will convert the codes into the Vec of logical operations.
Note that I’m using a macro here called split_up! which I made to simplify breaking up bitfields. The version_flags field, for instance, is equivalent to the bitfields for the version and flags fields of UNWIND_INFO and can be split using split_up!(info.version_flags => 3, 5).
            if let Some(func) = func {
                // We have unwind data!
                let info_addr = module.address + func.UnwindInfo as u64;
                let info = read_memory_data::<UNWIND_INFO>(memory_source, info_addr)?;
                let (_version, flags) = split_up!(info.version_flags => 3, 5);
                let (frame_register, frame_offset) = split_up!(info.frame_register_offset => 4, 4);
                let frame_offset = (frame_offset as u16) * 16;
                // The codes are UNWIND_CODE, but we'll have to break them up in different ways anyway based on the operation, so we might as well just
                // read them as u16 and then parse out the fields as needed.
                let codes = read_memory_full_array::<u16>(memory_source, info_addr + 4, info.count_of_codes as usize)?;
                let unwind_ops = get_unwind_ops(&codes, frame_register, frame_offset)?;
While there are 9 different UWOP_* constants, many of these are just different encodings for the same logical operations, so there are really only 6 operations we need to handle after we’ve parsed the unwind codes.
#[derive(Debug)]
enum UnwindOp {
    PushNonVolatile { reg: u8 },
    Alloc { size: u32 },
    SetFpreg { frame_register: u8, frame_offset: u16 },
    SaveNonVolatile { reg: u8, offset: u32 },
    SaveXmm128 { reg: u8, offset: u32 },
    PushMachFrame { error_code: bool }
}
Parsing the codes into an array of UnwindOps is straightforward, but needs to account for the variable length encoding. Each operation starts with a 16 bit code slot that describes the offset (from the beginning of the function), an operation, and an “info” field that gets interpreted in different ways depending on the operation. (Full code for get_unwind_ops is here)
fn get_unwind_ops(code_slots: &[u16], frame_register: u8, frame_offset: u16) -> Result<Vec<UnwindCode>, &'static str> {
    let mut ops = Vec::<UnwindCode>::new();

    let mut i = 0;
    while i < code_slots.len() {
        let (code_offset, unwind_op, op_info) = split_up!(code_slots[i] => 8, 4, 4);
        let code_offset = code_offset as u8;
        let unwind_op = unwind_op as u8;
        let op_info = op_info as u8;
Now we can have a big “match” to map the codes to the logical operations.
        match unwind_op {
            UWOP_PUSH_NONVOL => {
                ops.push(UnwindCode { code_offset, op: UnwindOp::PushNonVolatile { reg: op_info } });
            }
For operations that take multiple code slots, we’ll check that we have enough code slots left and increment the index to account for the slots consumed.
            UWOP_SAVE_NONVOL => {
                if i + 1 >= code_slots.len() {
                    return Err("UWOP_SAVE_NONVOL was incomplete");
                }
                let offset = code_slots[i + 1] as u32;
                ops.push(UnwindCode { code_offset, op: UnwindOp::SaveNonVolatile { reg: op_info, offset } });
                i += 1;
            }
Now that we have the list of logical unwind operations, we’ll find the operations that are applicable given the instruction pointer. Keep in mind that the unwind operations are described in terms of the “forward operation” of the prolog, and we need to execute the reverse of each of them. So for the “Push” operation, we’ll pop a register. For the “alloc” operation, we’ll deallocate space on the stack. Since the list of operations is already in reverse order we can iterate through the list and undo each operation. We do need to check the code_offset field to make sure that the operation has already been executed. If the current instruction is in the middle of the prolgue, we’ll skip any unwind operations that haven’t actually taken effect yet.
fn apply_unwind_ops(context: &CONTEXT, unwind_ops: &[UnwindCode], func_address: u64, memory_source: &dyn MemorySource) -> Result<Option<CONTEXT>, &'static str> {
    let mut unwound_context = context.clone();
    for unwind in unwind_ops.iter() {
        let func_offset = unwound_context.Rip - func_address;
        if unwind.code_offset as u64 <= func_offset {
            match unwind.op {
The UWOP_ALLOC_SMALL and UWOP_ALLOC_LARGE are both easy to reverse. Allocating memory on the stack means subtracting from the stack pointer. So deallocating is just adding to the stack pointer.
                UnwindOp::Alloc { size } => {
                    unwound_context.Rsp += size as u64;
                }
Similarly, to reverse a push, we need to pop a value. That means that we read the 64-bit value at the current RSP, store it to the indicated register, and then add 8 to the RSP. We’ll have a helper function called get_op_register that will map the numeric register value to a u64 reference for the indicated register inside the unwound_context.
                UnwindOp::PushNonVolatile { reg } => {
                    let addr = unwound_context.Rsp;
                    let val = read_memory_data::<u64>(memory_source, addr)?;
                    *get_op_register(&mut unwound_context, reg) = val;
                    unwound_context.Rsp += 8;
                }
A “save nonvolatile” operation is basically the same as a push except we don’t need to worry about updating the stack pointer, so it’s a bit simpler. This operation can have an offset, so we need to take that into account.
                UnwindOp::SaveNonVolatile { reg, offset } => {
                    let addr = unwound_context.Rsp + offset as u64;
                    let val = read_memory_data::<u64>(memory_source, addr)?;
                    *get_op_register(&mut unwound_context, reg) = val;
                }
Finally, the UWOP_SET_FPREG operation is a bit different. This operation means that the frame pointer is assigned the value of RSP plus an offset. The register being “saved” is actually RSP (typically because RSP will change by a variable amount, such as by using alloca). So to reverse this operation, we need to restore RSP by subtracting the frame_offset from the current value of the frame pointer. The frame pointer doesn’t have to be RBP, so we use get_op_register again.
                UnwindOp::SetFpreg { frame_register, frame_offset } => {
                    unwound_context.Rsp = *get_op_register(&mut unwound_context, frame_register) - (frame_offset as u64);
                }
                // Not implemented: UWOP_SAVE_XMM and UWOP_PUSH_MACFRAME
                _ => panic!("NYI unwind op")
            }
        }
    }
    Ok(Some(unwound_context))
}
Still with me? We’re almost done! We’ve rewound the prolog, but we still haven’t rewound the “CALL” instruction that kicked everything off, so that will be the last step. This part is also the only thing we need to do in the case of a leaf function, so back in the unwind_context function we’ll take care of both of those cases.
    let mut ctx = ctx;
    ctx.Rip = read_memory_data::<u64>(memory_source, ctx.Rsp)?;
    ctx.Rsp += 8;
And that’s it! All we need now is a new debugger command that repeatedly walks frames using the unwind_context function and we’re done!
Testing it out
Finally, we have a “k” command. Does it work?
> k
 #   RSP              Call Site
00 0x00000038E310FC48 hello.exe!func3+0x3
01 0x00000038E310FC50 hello.exe!func2+0x4A
02 0x00000038E310FD10 hello.exe!func1+0x9
03 0x00000038E310FD50 hello.exe!main+0x9
It does! It’s certainly not perfect, as there are a lot of missing cases still. But one really important case we’ve missed is how to unwind the stack when we’re in the epilog. But to do that correctly, we need to be able to unassemble x64 instructions. And really, what good is a debugger if it can’t show you assembly instructions? So I think you know what I’ll be doing in the next part of this series.
This series has been building towards this for a while, and I hope those of you that have been reading along found this interesting! Have a question or suggestion? Let me know! You can find me on Twitter, Mastodon, and Bluesky.